Temps, moisture and possibly time for scarification. When you buy crimson seed it is usually coated and seems to sprout readily due to the coating. Reseed does not have that advantage.Maybe someone with more of an Agronomy background can answer this question. In late spring, after the wheat and crimson clover had seeded out and died, I broadcast soybean and sorghum seed into the standing dead plots and then mowed. The soybeans and sorghum germinated and did OK. But all of that crimson clover seed from the seedheads did not germinate. The crimson clover only germinated after I mowed down the summer crop and sprayed in early to mid-August. Why did the Crimson Clover seed not germinate after the first mowing in late May? I realize Crimson is a cool season clover, but what prevented it from germinating anyways once it hit the ground?
You are using an out of date browser. It may not display this or other websites correctly.
You should upgrade or use an alternative browser.
You should upgrade or use an alternative browser.
Food Plots Mulch, and appropriate lime and fertilizer
- Thread starter BSK
- Start date
BSK
Well-Known Member
Very, very interesting Popcorn. Thanks for the info.Temps, moisture and possibly time for scarification. When you buy crimson seed it is usually coated and seems to sprout readily due to the coating. Reseed does not have that advantage.
BSK
Well-Known Member
This is going to sound crazy coming from someone who is all about measurement and data, but my biggest problem with doe numbers is figuring them out! Although I've been running season-long camera censuses for many years, the data collected is confoundingly contradictory, depending on "what the camera is pointed at." In essence, I get vastly different numbers from cameras over food sources versus any other camera location. And from what I can tell, it's all about how long deer of different sexes feed in one location. A doe group will feed in a plot for an hour or more, producing many pictures. yet quite often bucks just feed across the area one time, only producing a few pictures. This produces highly skewed sex ratio numbers because the does linger so long, producing a far higher number of repeat photographs per deer of the does compared to bucks. Yet when I look at cameras NOT pointed at food sources - any type of non-food source - I get numbers closer to what I believe are real and what we observe while hunting. So which numbers to use? I compare them both. But I take the food plot data with a huge grain of salt.Just wait... let's revisit in 2 yearsdoes are gonna take your place over!
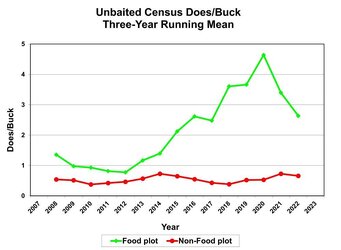
Below is a graph of my camera census adult sex ratio (does/buck) for cameras pointed into food plots versus all camera locations not pointed into food plots. Notice the massive rise in calculated does per buck for food plots but NOT for other locations. Also of interest, why did the doe numbers peak around 2020 in food plots and then begin to fall? My suspicion is because that is when we cut a lot of timber and produced a lot of natural forage, hence does no longer needed to relly on the food plots as a food source.
Attachments
megalomaniac
Well-Known Member
When I say 'doe sink' I'm more referring to does taking over the very best food sources and displacing the bucks and pushing them off (for the entire year except for Oct, Nov, Dec).This is going to sound crazy coming from someone who is all about measurement and data, but my biggest problem with doe numbers is figuring them out! Although I've been running season-long camera censuses for many years, the data collected is confoundingly contradictory, depending on "what the camera is pointed at." In essence, I get vastly different numbers from cameras over food sources versus any other camera location. And from what I can tell, it's all about how long deer of different sexes feed in one location. A doe group will feed in a plot for an hour or more, producing many pictures. yet quite often bucks just feed across the area one time, only producing a few pictures. This produces highly skewed sex ratio numbers because the does linger so long, producing a far higher number of repeat photographs per deer of the does compared to bucks. Yet when I look at cameras NOT pointed at food sources - any type of non-food source - I get numbers closer to what I believe are real and what we observe while hunting. So which numbers to use? I compare them both. But I take the food plot data with a huge grain of salt.
Below is a graph of my camera census adult sex ratio (does/buck) for cameras pointed into food plots versus all camera locations not pointed into food plots. Notice the massive rise in calculated does per buck for food plots but NOT for other locations. Also of interest, why did the doe numbers peak around 2020 in food plots and then begin to fall? My suspicion is because that is when we cut a lot of timber and produced a lot of natural forage, hence does no longer needed to relly on the food plots as a food source.
In areas I started a new plot, I would typically have several velvet bucks using it the first season. As the plot became more productive, does with their fawns took them over and displaced those velvet buck bachelor groups. It's really hurt my velvet season hunts the more productive the plots have become.
The second problem is how rapidly the doe population can expand in areas with additional food sources and coyote reduction. One property I bought 5 years ago had ONE resident doe on it. Now it has 14 (well, actually now 12, since we killed 2 there this year). Used to have a bachelor group of 5 to 7 bucks all summer long, now only one or 2 yearling bucks in summer. The flip side is it picks up 10 to 15 bucks roaming thru during the rut (78 acres).
BSK
Well-Known Member
I used to see just the opposite. I would have a lot of bucks in summer because my property had far lower resources than the surrounding bottomlands. Does were in the bottoms and the bucks lived in my hilly hardwoods all summer. Then we started cutting timber and planting food plots and I saw exactly what you described. I would have several doe groups and their fawns all summer yet only a couple of scrawny yearling bucks in velvet.When I say 'doe sink' I'm more referring to does taking over the very best food sources and displacing the bucks and pushing them off (for the entire year except for Oct, Nov, Dec).
I swear, you can't win!
Wish I had a drill, but I can't justify the expense.
BSK
Well-Known Member
Me either. Plus I think a drill would be damaged in my rock-pile food plots.Wish I had a drill, but I can't justify the expense.