More meaningless data (but a question)

BSK

Well-Known Member
Joined
Mar 11, 1999
Messages
81,152
Location
Nashville, TN
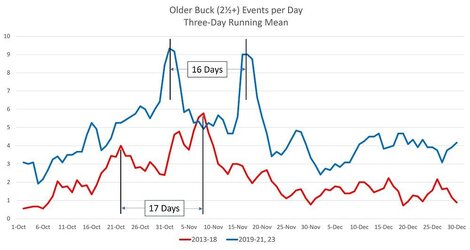
So I've been tracking my personal trail-camera data for quite some time. Recently, I went back and added in all the data for October for the last 11 years (I had only been looking at my hunting months - November and December - previously. But I began to notice something odd. As most hunters know, on any given property, there will be peak traditional dates for buck activity. This held true for my property as well. The peak date year after year was Nov. 8, which corresponds with the beginning of our peak breeding. And by entering October data, I found a second but smaller peak about October 22, approximately 17 days earlier.

All well and good. But over the last few years, ever since a remnant hurricane moved up KY Lake in 2019 producing 110 MPH straight line winds which levelled much of the forests along the lake, we've noticed a change in patterns. Starting that year, our peak dates changed. So in the below graph I've illustrated the average daily older bucks (2 1/2+) caught on camera from 2013 to 2018 (red line), and then the same data from 2019 onwards (aqua line), with the exception of 2022 which was a crazy year due to the drought. Notice in the graph that the 2019+ data still shows two peaks, approximately 16-17 days apart, but since 2019, these two peaks are delayed 9-10 days compared to the earlier years.

So my question is, anyone ever seen anything like this? In that a major habitat change (downed timber and then logging to remove downed timber) produces a change in what dates see the best buck activity? I've seen changes in herd dynamics do this, but not changes in habitat. Changes in habitat usually just change the number of deer using the area, and which areas are best for buck activity, but not changing dates of best activity. And for what it's worth, the higher overall values post hurricane (2019+) are real. The massive habitat changes have increased the number of older bucks using the property.
 

Attachments

  • Olderprepost19.jpg
    Olderprepost19.jpg
    46.6 KB · Views: 11

Popcorn

Well-Known Member
2-Step Enabled
Joined
Jan 30, 2019
Messages
3,556
Location
Cookeville, TN Cadiz, KY and random other places
Wow! Interesting. It's a long shot at best but any chance trees lost and or removed were by and large the same variety / specie mast bearing trees that would have affected food availability dates? For example if you remove the majority of a dominant food source then you move the biology related to that ample and nourishing food source to coincide with the next. ie; white oak family to red oak family. Pure speculation
That's all I got
 

BSK

Well-Known Member
Joined
Mar 11, 1999
Messages
81,152
Location
Nashville, TN
Popcorn, 90% would have been mature White Oak because 90% of our forest is mature White Oak. But we still have a ton of those.
 

TheLBLman

Well-Known Member
Joined
Jun 12, 2002
Messages
38,063
Location
Knoxville-Dover-Union City, TN
How does your data coincide with the broader area's deer density (annually)?
Just wondering if the area deer density might be a more significant factor than those straight line winds.

I have no answers, just pondering questions :)
 

BSK

Well-Known Member
Joined
Mar 11, 1999
Messages
81,152
Location
Nashville, TN
How does your data coincide with the broader area's deer density?

I have no answers, just pondering questions :)
Our local density has gone up dramatically because of the much improved habitat. Surrounding area, some increase as a direct result of decreasing hunter density and more "picky" hunters, but nowhere near the increase we are seeing on our property. Our fall-season density has nearly doubled.
 

TheLBLman

Well-Known Member
Joined
Jun 12, 2002
Messages
38,063
Location
Knoxville-Dover-Union City, TN
Our fall-season density has nearly doubled.
Much of that may be improved habitat related?

I also suspect the elimination of "earn-a-buck" doe slaughtering on some bordering properties of significant acreage is a part of this equation.

That "earn-a-buck" annual slaughter's sudden ending was a huge decrease in hunting "pressure", even if the same number of hunters were afield next door. With all the food resources (next door, as well as your property improvements), herd health should have sky-rocketed.
 

BSK

Well-Known Member
Joined
Mar 11, 1999
Messages
81,152
Location
Nashville, TN
Much of that may be improved habitat related?

I also suspect the elimination of "earn-a-buck" doe slaughtering on some bordering properties of significant acreage is a part of this equation.
I think you and Lost Lake on to it. I bet it's the increased local population. I knew our better habitat was drawing more deer, but I hadn't thought about how many more deer now exist on the Refuge.
 

kaizen leader

Well-Known Member
Joined
Aug 29, 2022
Messages
706
Location
Nashville
So I've been tracking my personal trail-camera data for quite some time. Recently, I went back and added in all the data for October for the last 11 years (I had only been looking at my hunting months - November and December - previously. But I began to notice something odd. As most hunters know, on any given property, there will be peak traditional dates for buck activity. This held true for my property as well. The peak date year after year was Nov. 8, which corresponds with the beginning of our peak breeding. And by entering October data, I found a second but smaller peak about October 22, approximately 17 days earlier.

All well and good. But over the last few years, ever since a remnant hurricane moved up KY Lake in 2019 producing 110 MPH straight line winds which levelled much of the forests along the lake, we've noticed a change in patterns. Starting that year, our peak dates changed. So in the below graph I've illustrated the average daily older bucks (2 1/2+) caught on camera from 2013 to 2018 (red line), and then the same data from 2019 onwards (aqua line), with the exception of 2022 which was a crazy year due to the drought. Notice in the graph that the 2019+ data still shows two peaks, approximately 16-17 days apart, but since 2019, these two peaks are delayed 9-10 days compared to the earlier years.

So my question is, anyone ever seen anything like this? In that a major habitat change (downed timber and then logging to remove downed timber) produces a change in what dates see the best buck activity? I've seen changes in herd dynamics do this, but not changes in habitat. Changes in habitat usually just change the number of deer using the area, and which areas are best for buck activity, but not changing dates of best activity. And for what it's worth, the higher overall values post hurricane (2019+) are real. The massive habitat changes have increased the number of older bucks using the property.
I appreciate the info. Thank you for sharing. Sorry I can't add anything.
 

BSK

Well-Known Member
Joined
Mar 11, 1999
Messages
81,152
Location
Nashville, TN
I get a large amount of daylight movement of older bucks at the same time of October. It lasts about 3 days

But my rut peak breeding is first week of December.
That is VERY interesting. have you ever tried to figure out why that October peak occurs? Looked for any specific link to those dates?
 

BSK

Well-Known Member
Joined
Mar 11, 1999
Messages
81,152
Location
Nashville, TN
Bet this is the single biggest influence on the changes you have seen.
Doe numbers have increased DRAMATICALLY. While the Refuge was using Earn-A-Buck to reduce their deer population, hunters were killing anything without antlers so they could get their buck permit. Our local adult sex ratio dropped to 2 bucks per doe. Now that the Refuge has ended their program, the sex ratio is back to more normal numbers. In fact, now we're about where I want to be, about 1.5 does per buck.
 

Latest posts

Top