BSK
Well-Known Member
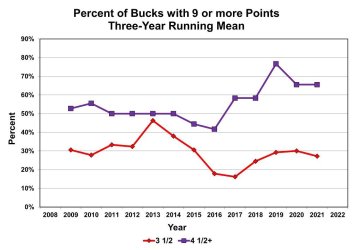
TheLBLman and I have written quite a bit about buck high-grading, where the largest antlered middle-aged bucks get killed by hunters, leaving only the smaller-antlered middle-aged bucks to survive to maturity. One of the ways I look for that in data is to look at the percent of 3 1/2 and mature (4 1/2+) bucks by antler point counts, especially looking for the percent of these age-class bucks with 9 or more points, as well as 6 or fewer points. When the percent of bucks in these age-classes with 9 or more points begins to fall, and the percent with 6 or fewer points begins to climb, high-grading is usually the culprit (as long as nutrition hasn't declined dramatically).
I was breezing through the data from my own property, and the percent of 3 1/2 and 4 1/2+ year-old bucks with 9 or more points looked good (see first graph below). A dip in these numbers occurred around 2017, but since then, the numbers aren't bad at all. For the region, 50+% of mature bucks with 9 or more points is excellent.
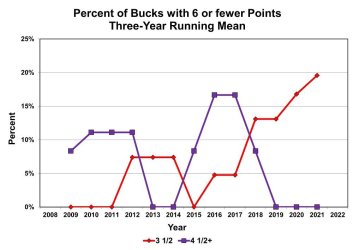
However, then I looked at the percent of those age bucks with 6 or fewer points (second graph below). Uh oh... Any time the percent of 4 1/2+ year-old bucks with 6 or fewer points is HIGHER than that for 3 1/2 year-old bucks, something is up. Something is happening between 3 1/2 and 4 1/2+ that is increasing the percent of mature bucks with 6 or fewer points. The graph indicates two period this occurred: 2009-2012 and 2015-2017. Is this high-grading? Probably. What is more worrying is the steady increase in percentage of 3 1/2 year-olds that have 6 or fewer points 2016 onwards, which is continuing to increase. Now the ultimate result - reduced high point count mature bucks - is not being seen. We are peaking in 9 or more point mature bucks. But the 6 or fewer data is troubling and a harbinger of a potential problem.
I was breezing through the data from my own property, and the percent of 3 1/2 and 4 1/2+ year-old bucks with 9 or more points looked good (see first graph below). A dip in these numbers occurred around 2017, but since then, the numbers aren't bad at all. For the region, 50+% of mature bucks with 9 or more points is excellent.
However, then I looked at the percent of those age bucks with 6 or fewer points (second graph below). Uh oh... Any time the percent of 4 1/2+ year-old bucks with 6 or fewer points is HIGHER than that for 3 1/2 year-old bucks, something is up. Something is happening between 3 1/2 and 4 1/2+ that is increasing the percent of mature bucks with 6 or fewer points. The graph indicates two period this occurred: 2009-2012 and 2015-2017. Is this high-grading? Probably. What is more worrying is the steady increase in percentage of 3 1/2 year-olds that have 6 or fewer points 2016 onwards, which is continuing to increase. Now the ultimate result - reduced high point count mature bucks - is not being seen. We are peaking in 9 or more point mature bucks. But the 6 or fewer data is troubling and a harbinger of a potential problem.
")