BSK
Well-Known Member
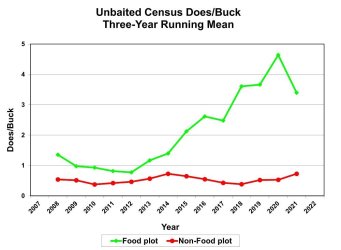
Just throwing this out there for all those who run camera censuses on their property: has anyone else observed rapidly increasing adult sex ratio data from cameras over food plots but NOT at other locations? I ask because I've noticed that with each passing year, I'm getting many, many more pictures of does feeding in food plots but not bucks. I may get 50 set of pictures of the same 3 does and 2 fawns feeding in a plot over an hour's time, but when a buck comes by I just get one or two sets of pictures as he feeds across the plot. The bucks almost never stay and feed for long periods of time. This doe-heavy feeding in food plots really skews my sex ratio data. In fact, I've gone to calculating my sex ratio data separating food plot data from all other camera locations. The food plot data shows a sky-rocketing number of does per buck while all other camera locations combined do not show this trend. I have no idea which number is "real" (and possibly neither are). Anyone else seen anything like this? Below is a graph (a three-year running mean) of calculated adult sex ratios for food plot cameras versus cameras not pointed into food plots since 2007. Notice how fast the adult sex ratio is skewing towards does in the food plot data but not for all other locations.